The hispanic/latino population:
on the rise
The Hispanic/Latino population has been on the rise for many of years, within twelve years the population grew by 53 million. A fifty percent increase and nearly six times the population of Latinos in the 1970s. Just within the United States the Latino population grew 12% within the twelve years. Latino origin is predicted to make up 29% of the population by 2050.
Quick stats
Currently, 318,857,056 is the estimated population of the United States roughly 70% of the population is made up of the Hispanic/Latino Origin. The U.S is ranked second behind Mexico for the largest population of Hispanics.
64% of those of Hispanic/Latino origin in the U.S were of Mexican background in 2013. Between the years of 2013 and 2014 the Hispanic population grew 2.1%.
This makes Mexicans the largest Latino subgroup.
This makes Mexicans the largest Latino subgroup.
|
|
The two states within the United States that have the highest Hispanic/Latino population are:
California & New Mexico California has 14.1 million Latinos, and New Mexico's population is 64% being of Latino origin. |
AGE & residence
- Hispanics of Mexican origin have a median age of 25 years old making them the youngest.
- Cuban origin has the midpoint age of 40 years old.
- 80% of Hispanics/Latinos are concentrated in 9 states: California, Texas, Florida, New York, Illinois, Arizona, New Jersey, Colorado and New Mexico.
Education
As minority groups face issues with education, so does the Latino communities. The lack of funding for the minority and the disadvantaged students, as well as the other special needs, impact the community. In 2012, 28,445 Latino students attended high school. 16.4% of that population left high school with no diploma, however 30% of the school did graduate with their diploma.
|
|
5,818 received some college or received an associate’s degree (20.5%)
2,935 received bachelor’s degree 4.2% of the Hispanic population received a degree higher than Bachelors. |
|

|
Within the next year of the percentage of high school graduates increased to 64.7%.
occupation
Latinos have gained 2.8 million jobs since the recession ended. Of those 2.8 million, 453,000 of those jobs went to immigrants. The unemployment rate in 2007 was 5.2% for Latinos and by 2009 it rose to 11.8%. The most recent unemployment rate for Latinos have dropped back down in 2013 to become 7.2%. As the recession lost many of jobs for the Latinos only 10% of the jobs were regained.

67% of Hispanics/Latinos 16 or older worked in civilian labor force
19.6% of the civilian employed Hispanics/Latinos 16 and older worked in management, business science and art occupations
Seasonal unemployment in Hispanics fell from 8.7% to 8.1% in 2013 to 2014.
INCOME
The median income a week for Latinos have increased slowly over the years. Full time Hispanic workers earned a median income of $570 a week in 2013 compared to $556 in 2007. U.S-born Hispanic workers had a median of $684 in 2007 and it decreased to $640 by the year of 2013. Those who were foreign-born Hispanics has an unchanged median that stayed at $500.
- The average income for the Hispanic origin have been rising over the years. In 1975 the average income was $28,350 and in 2013 the average income was $40,963.

Latinos hold the ranking for being the largest minority group among the fast growing populations. The Latinos young adults are victim that are speaking out in the United States.
GENDER DIFFERENCES
LATINASYoung Latina’s cope with dual stereotypes that merge assumptions about gender and culture and that consequently paint them as submissive, as caretakers, as lacking in ambition, and as unlikely to attend college in favor of starting a family early—stereotypes that are often reinforced by their families, communities, schools, and the media.
|
LATINOSLatino boys, for their part, are more likely to be assumed to be troublesome and criminal, and tend to be sensitive to the feeling of being surveilled, contained, and treated as criminals by authorities indifferent locations such as schools and neighborhoods. The boys are said to have it worse than the Latino girls do. Because the boys are told to go out and experience the outside world where there is discrimination. While they tell the girls to remain within and protect the space and home of the family.
|
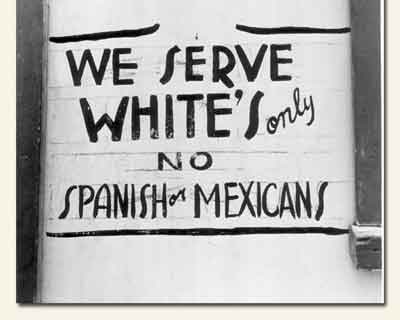
DISCRIMINATION AND IMMIGRATION
In 2010, the state of Arizona passed a law authorizing local police to check the immigration status of anyone they reasonably suspect of being in the United States illegally.
- 23% of Americans now say that Hispanics face more discrimination than African Americans.
- Within the work environment, three in every ten Hispanics feel they are discriminated against.
References:
- Discrimination Against Hispanics, Latinos and Mexican Americans, and the Need For More Civil Rights Lawyers in California (n.d.). In HG.org Legal Sources.
Retrieved from http://www.hg.org/article.asp?id=6051
- Discrimination against Hispanics (2010, January 19). In Pew Research Center. Retrieved from http://www.pewresearch.org/daily-number/discrimination-against-hispanics/
- Foxen, P. (n.d.). Speaking Out: Latino Youth on Discrimination in the United States. In Academia. Retrieved from
https://www.academia.edu/1141711/Speaking_Out_Latino_Youth_on_Discrimination_in_the_United_States
- Hispanic Americans By the Numbers (n.d.). In Infoplease. Retrieved from http://www.infoplease.com/spot/hhmcensus1.html
- Hispanic Demographics (n.d.). In National Educational Center. Retrieved from http://www.nea.org/home/15536.htm
- Hispanic Origin (2012). In United States Census Bureau. Retrieved from http://www.census.gov/population/hispanic/data/2012.html
- Kochhar, R. (2014, June 19). Latino Jobs Growth Driven by U.S. Born. In Pew Research Center. Retrieved from
http://www.pewhispanic.org/2014/06/19/latino-jobs-growth-driven-by-u-s-born/
